Free Accounting.BI PowerBI Dashboards for Multiple Xero Organisations

June 15, 2023

Interact with our Free Accounting.BI PowerBI Dashboards for Multiple Xero Organisations using informative video attached below.

Additionally, go through the article below;

Our article below provides a step-by-step breakdown guide on the Dashboards in clear and structured explanation.

Free Power.BI template that synchronizes directly to Xero.

  • Overview of the Power.BI template and its availability

This particular example explains that the Power.BI template is not only accessible in Power.BI desktop but also in the Power.BI service through shareable links or Power.BI axe.

So, how does this work?

  • Business Overview Page

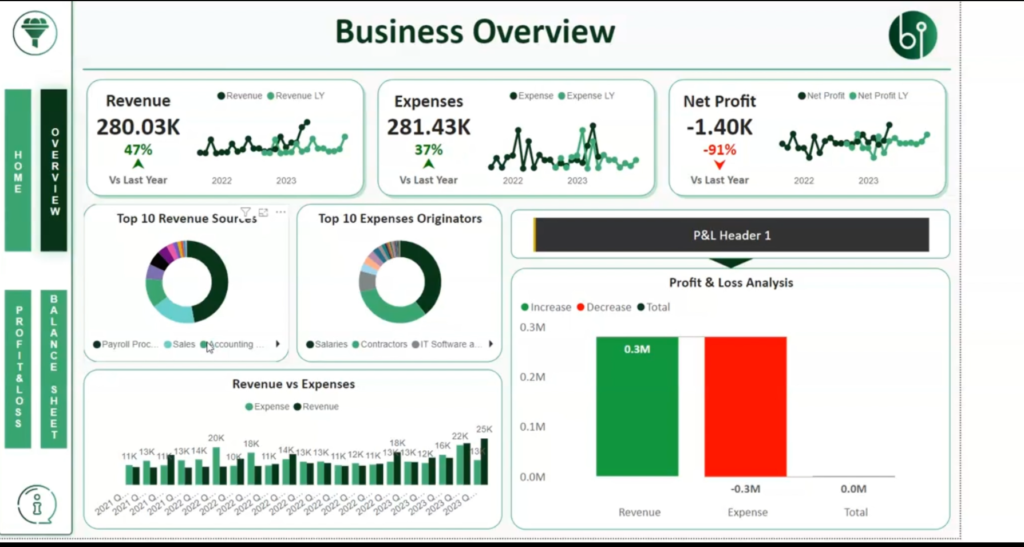
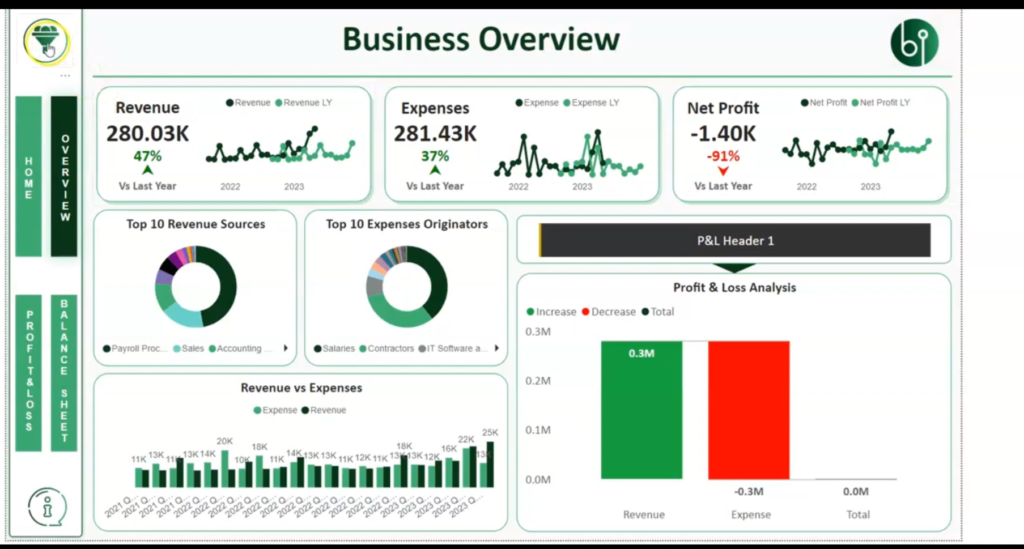
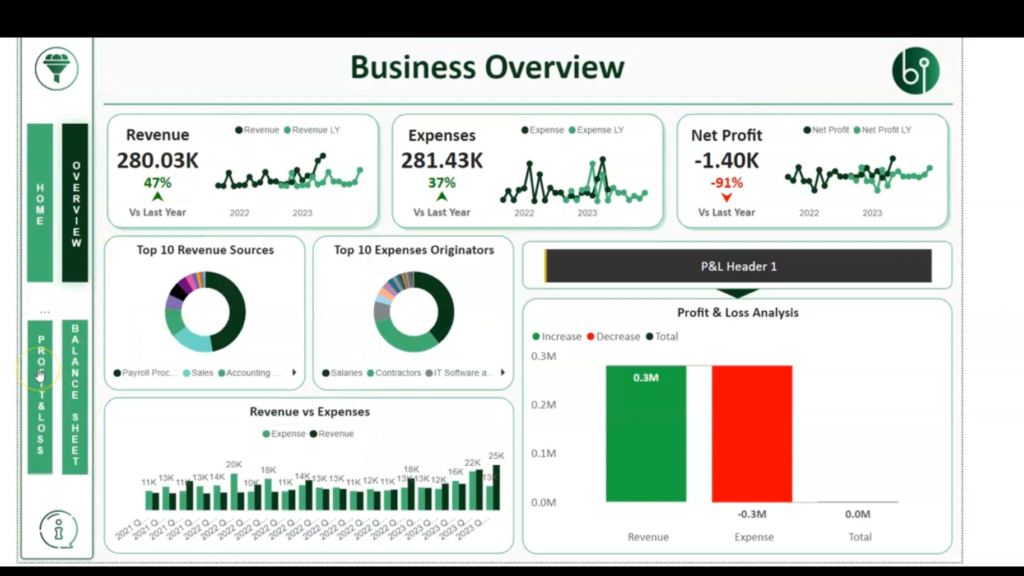
The Business Overview page is highlighted as a central component of the dashboards.

Most businesses will have a 'Business Overview page' that showcases the different binary features that can be built within the dashboards.

  • Demonstrating the Filter Card feature for company selection

Click on the Filter Card feature, which is highlighted in yellow. This feature allows users to select different companies from the drop-down menu.

In this particular example, we've got two companies but it could be as many companies as you wish.

  • Financial Dashboard for a single company

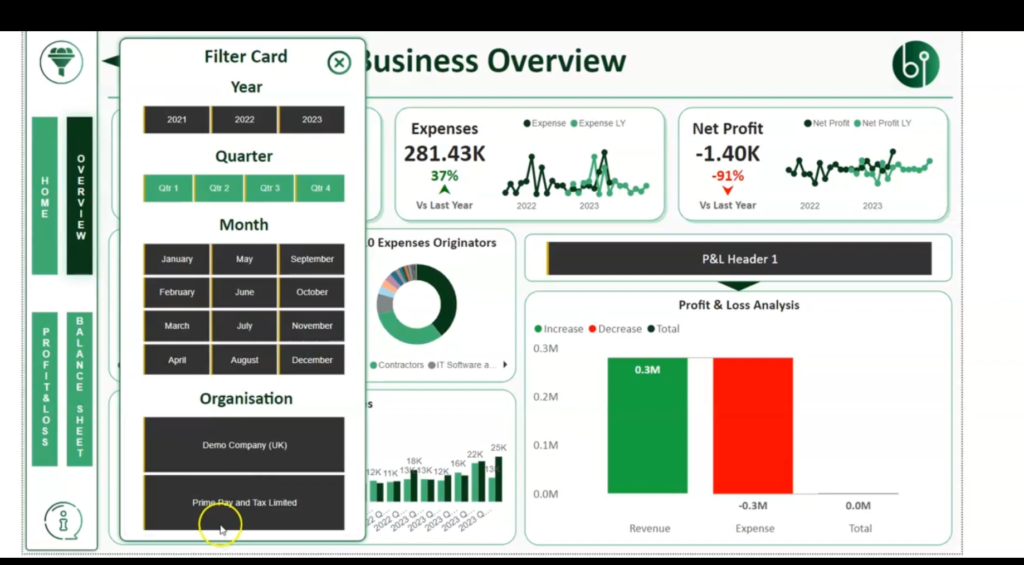
When a company is selected using the Filter Card, the data within the dashboard filters and changes to represent the selected company.

For instance we begin with the Demo Company(UK), which is of a black color, we'll see the data of the dashboard change just to represent that company.

  • Financial consolidation for multiple Xero entities

The dashboard supports financial consolidation by incorporating data from multiple Xero entities. This allows us to analyze and compare data from different companies.

If we want to start incorporating the two companies' data, we start running financial consolidation with both Xero entities.

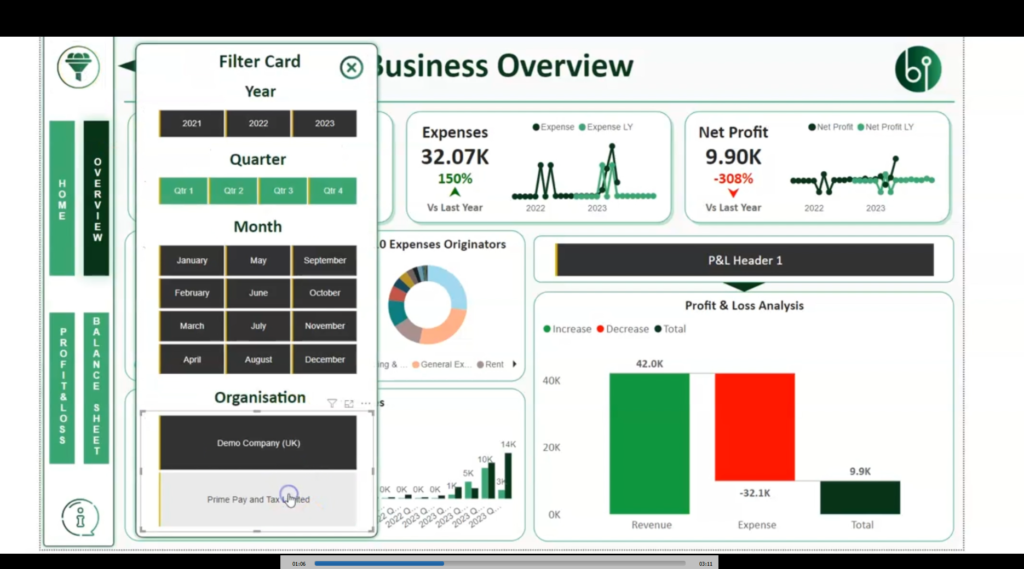
You can obviously do as many as you like, albeit the Power.BI dashboard may not handle unlimited.

  • Navigate to the Profit and Loss Statement

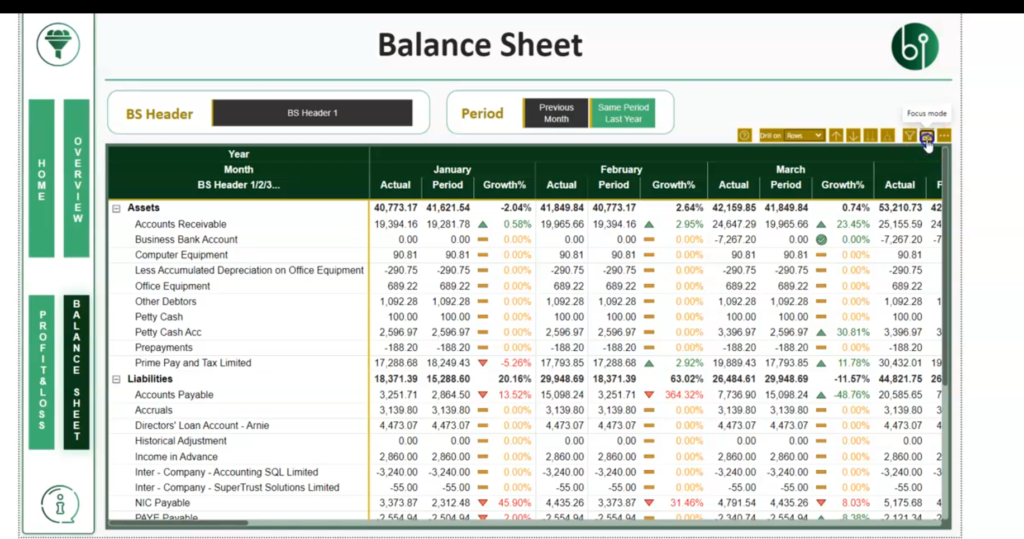
We also try to give Accounting.BI users, the idea on how they can start building their financial statements.

  • Visualizing your profit and loss statement using the dual-down functionality.

  • Using the same Filter Card, you can draw down through the expenses and then draw down to the revenue.

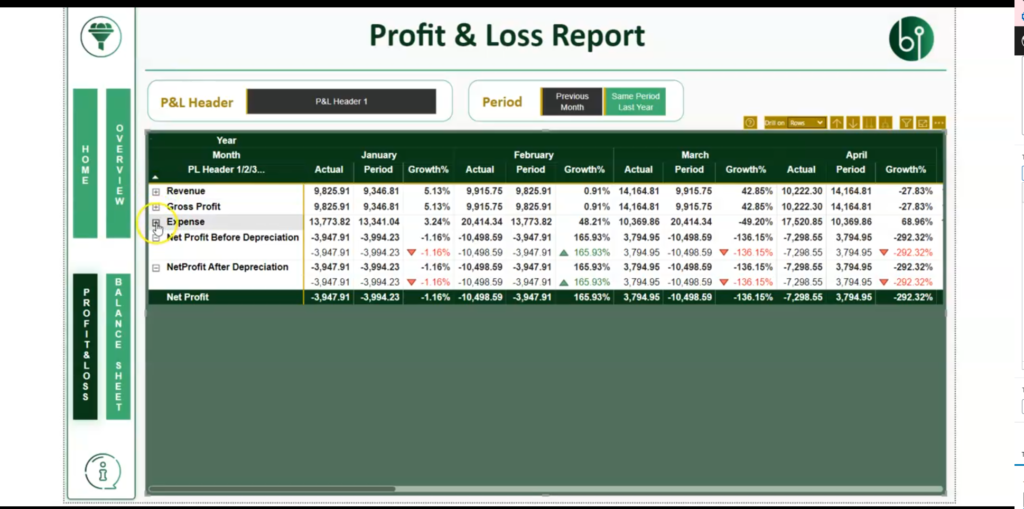
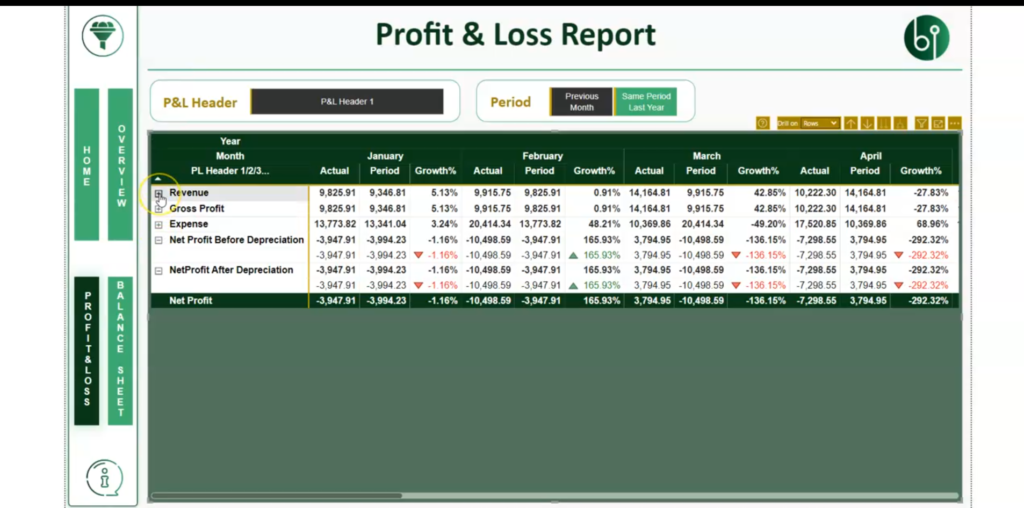
The dual-down functionality enables users to drill down into specific details within the Profit and Loss section. They show how expenses and revenue can be explored in more detail using this feature.

  • Apply the same approach to the Balance Sheet sector, highlighted in yellow, and explore assets and liabilities

  • Synchronization with Xero and Data Refresh

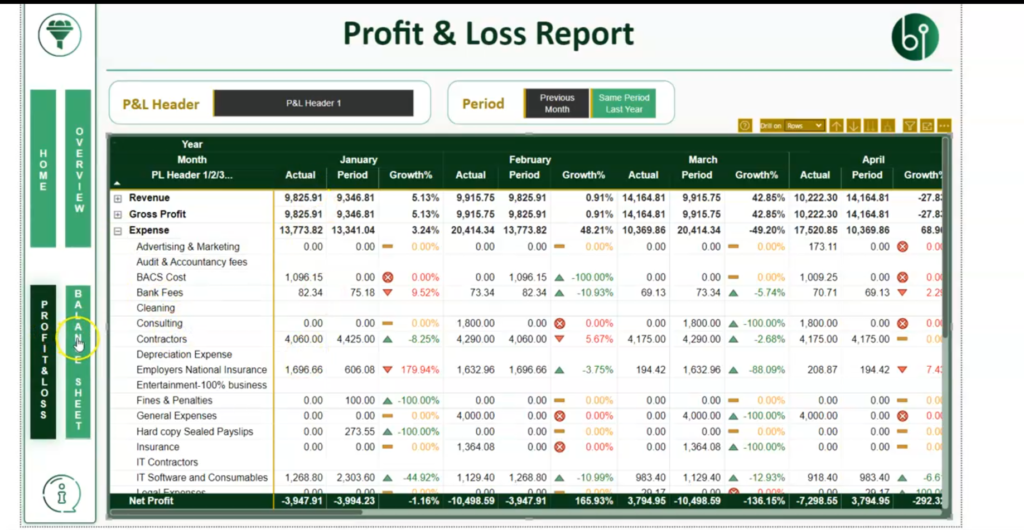
The data within the dashboards is entirely synchronous with Xero, ensuring real-time information.

To generate the list of data fetched, click on the icon highlighted in the diagram below,

  • Explanation of the refresh options

So you can refresh the data, on-demand, timed intervals (e.g., every ten minutes, everyday and pretty much as you like (customized schedules). It's a truly real-time dashboard.

  • Future Features related to printable reports and management accounting practices

The upcoming features that we'll be releasing soon is how you can deal with printable reports and proper management accounting practices.

This particular example is designed to show you primarily a very basic dashboard on where you can start. Get a Power.BI developer either within our team or a third party Power.BI developer to start working on reports and develop something quite substantial for your organisation or accounting firm.

Don't hesitate to contact us for expert guidance and solutions.

learn more

Why is PowerBI important for Accountants?

As an accountant, you may find yourself referring to multiple sources to track the performance of your client’s cash flow, profitability, business trends and even bookkeeping cycle. What if you could access those results and comparisons automatically refreshed, on-demand, from your tablet, smartphone, PC, or even wearable device? Business intelligence and data visualisation systems can provide accountants with – the critical data and organisation summary in a custom format in one (or more) visuals or a dashboard. One of these powerful business intelligence tools is PowerBI.
READ MORE

Power BI: What is DAX?

DAX (Data Analysis Expressions) is a formula expression language developed by Microsoft to interact with data in different analysis services and visualisation tools platforms like Power BI, PowerPivot and SSAS tabular models. DAX can seem familiar to competent excel users as the language uses similar formulas and expressions.
READ MORE

How to connect your Xero account(s) to AccountingBi

This guide will walk you through two methods for connecting your Xero accounting software to AccountingBi
READ MORE

How to call your profit and loss account reports from Xero to AccountingBi

We have outlined a step-by-step process of calling your profit and loss report data from your Xero account to AccountingBi - article and video.
READ MORE

How to call the balance sheet reports from Xero to AccountingBi

We have outlined the steps of calling balance sheet reports from Xero to AccountingBi in a video (watch below) and an article.
READ MORE

How to connect Microsoft excel to Xero through AccountingBi

This video and article provide steps for connecting Xero to PowerBi through AccountingBi. It assumes that you've already pulled the Xero API from accounting BI for your various reports.
READ MORE
1 2 3 5
READ MORE
Accounting.bi - Business Intelligence Software
Copyright © 2023 Accounting.bi is a brand owned and operated by Accounting SQL Limited, incorporated in the United Kingdom. ​
Terms & Conditions - GDPR
How, can we help?