Automation set up for Profit and Loss Report

June 11, 2024

This guide simplifies generating your P&L report automatically using AccountingBi and your Xero organisation.

Step 1: Connect your Xero Organisation to AccountingBi

  • Visit this link to learn how to connect your Xero Account to AccountingBi.
  • Follow the instructions provided on the page to complete the connection process.
  • Once connected, generate your Chart of Accounts (COA) reports using this link.

Step 2: Set up Automation for Reports

Without Tracking Categories

1.Go to the “Reports” tab in “AccountingBi

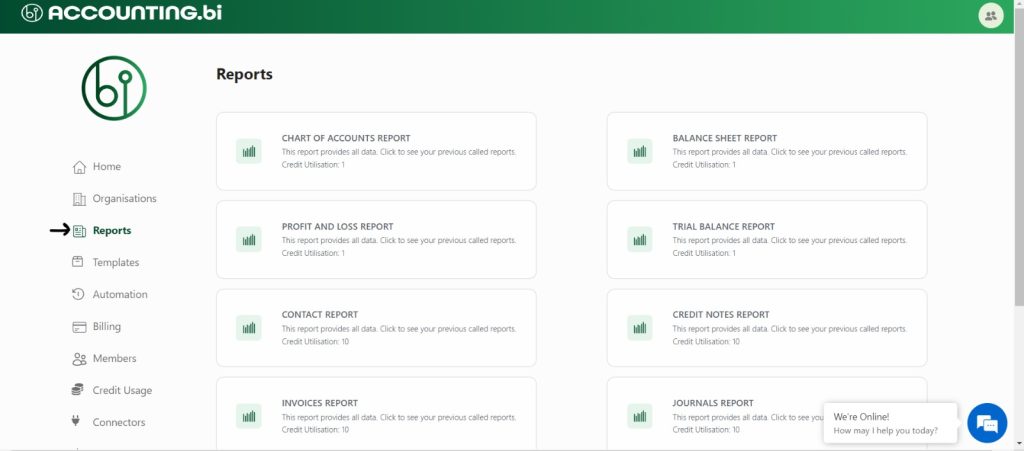
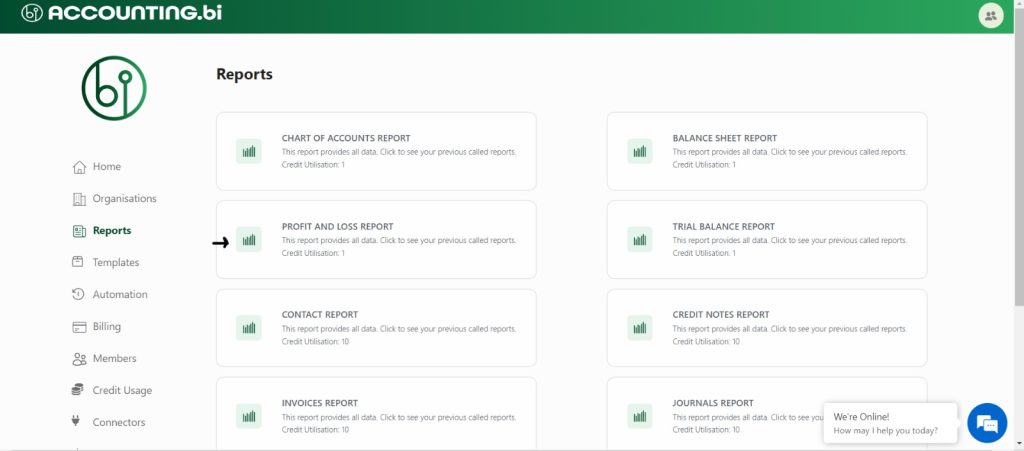
2. Select the “Profit and Loss” report

3. For non-US organisations, set “Standard Layout” to “Yes”; for US organisations, set it to “No”.

If tracking categories are present, select them from the Extra Section.

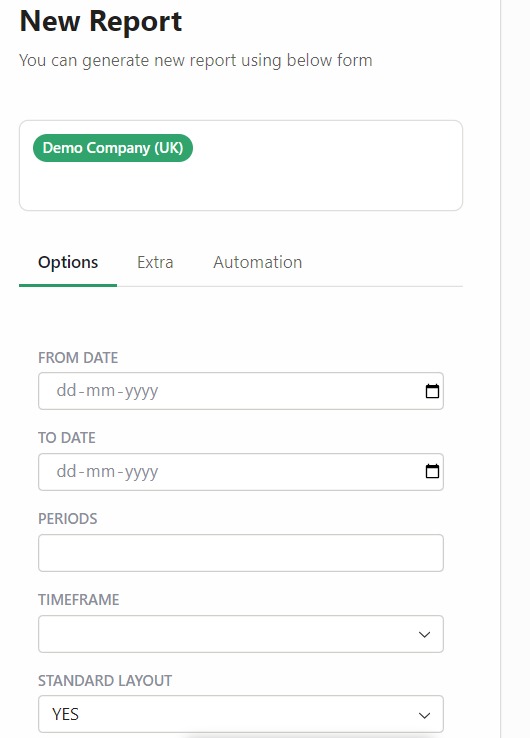
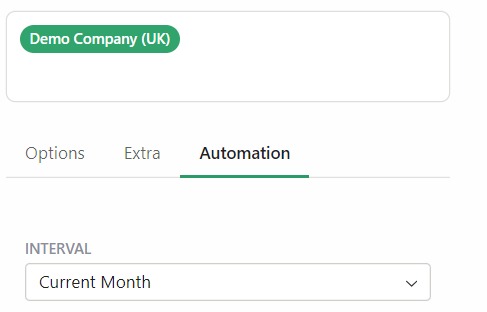
4.Proceed to the Automation section.

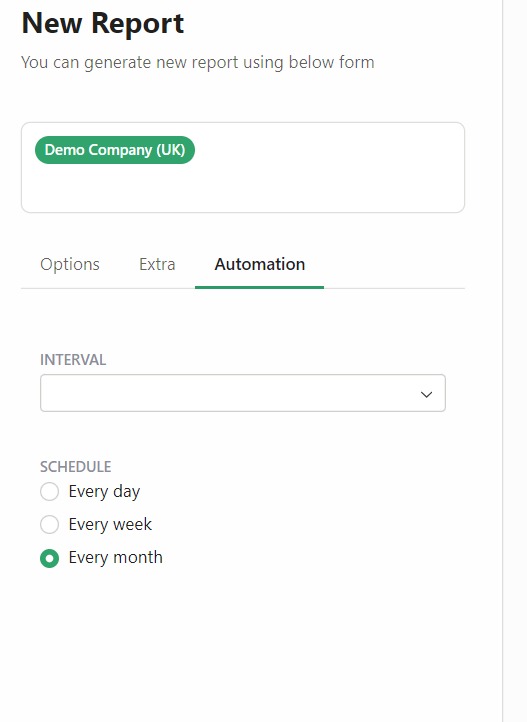
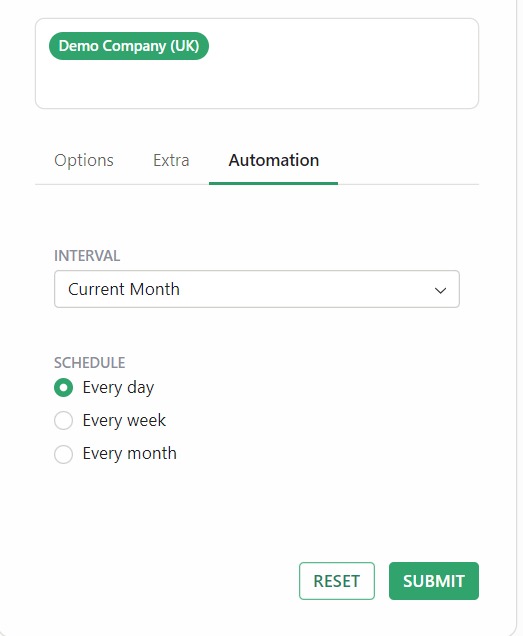
5. Choose the desired interval for the report (e.g., current month, previous month)

6. Set the automation frequency (daily, weekly) and then click “Submit”.

7. The report will now be generated automatically based on your chosen schedule.

You can then access the report and review it.

Step 3: Verify Automation Schedule

1.Navigate to the “Automation” section

2.Verify the date and time when the next report will be automatically generated based on your configured settings.

Step 4: View Data in Excel and PowerBi

For Excel integration, follow this guide: https://accounting.bi/tips/how-to-connect-microsoft-excel-to-xero-through-accountingbi-2/

For PowerBi integration, follow this guide: https://accounting.bi/tips/connecting-power-bi-to-accounting-bi/

"Don't hesitate to contact us for expert guidance and solutions."

learn more

Why is PowerBI important for Accountants?

As an accountant, you may find yourself referring to multiple sources to track the performance of your client’s cash flow, profitability, business trends and even bookkeeping cycle. What if you could access those results and comparisons automatically refreshed, on-demand, from your tablet, smartphone, PC, or even wearable device? Business intelligence and data visualisation systems can provide accountants with – the critical data and organisation summary in a custom format in one (or more) visuals or a dashboard. One of these powerful business intelligence tools is PowerBI.
READ MORE

Power BI: What is DAX?

DAX (Data Analysis Expressions) is a formula expression language developed by Microsoft to interact with data in different analysis services and visualisation tools platforms like Power BI, PowerPivot and SSAS tabular models. DAX can seem familiar to competent excel users as the language uses similar formulas and expressions.
READ MORE

How to connect your Xero account(s) to AccountingBi

This guide will walk you through two methods for connecting your Xero accounting software to AccountingBi
READ MORE

How to call your profit and loss account reports from Xero to AccountingBi

We have outlined a step-by-step process of calling your profit and loss report data from your Xero account to AccountingBi - article and video.
READ MORE

How to call the balance sheet reports from Xero to AccountingBi

We have outlined the steps of calling balance sheet reports from Xero to AccountingBi in a video (watch below) and an article.
READ MORE

How to connect Microsoft excel to Xero through AccountingBi

This video and article provide steps for connecting Xero to PowerBi through AccountingBi. It assumes that you've already pulled the Xero API from accounting BI for your various reports.
READ MORE
1 2 3 7
READ MORE
Accounting.bi - Business Intelligence Software
HOW IT WORKS...
Copyright © 2024 Accounting.bi is a brand owned and operated by Accounting SQL Limited, incorporated in the United Kingdom. ​
Terms & Conditions - GDPR